|
www.tlab.it
Modeling of Emerging
Themes
This T-LAB
tool provides a simple way of discovering,
examining and modeling, the main themes or topics
(henceforward 'theme' and 'topic' will be used synonymously)
emerging from texts. Subsequently they can be explored further with
several tools, either by keeping separate or by combining
qualitative and quantitative approaches.
In fact, themes - which are described through their characteristic
vocabulary and consist of co-occurrence
patterns of key-terms - can be
used as categories in further analyses or for automatically
classifying the context units (i.e.
documents or elementary contexts).
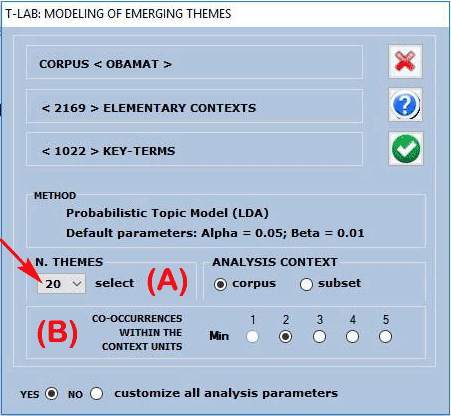
A T-LAB
dialog box (see above) allows the user to set two analysis
parameters.
In particular:
- the (A) parameter allows the user to set the amount (i.e. a fixed
number) of themes to be obtained. (Note that the higher this number
is the more consistent the co-occurrence patterns are; moreover, if
necessary, some themes - e.g. those that are redundant or difficult
to interpret - can be discarded later);
- the (B) parameter allows the user to exclude from the analysis
any context unit that doesn't contain a minimum number of key-words
included in the list which is being used.
Only when choosing to customize all analysis
parameters (see the above 'Yes'
option'), the following window will appears and more options will
be available. (Note that in the below picture the number of context
units is determined by the above parameter 'B').

The analysis procedure
consists of the following steps:
a - construction of a document per word matrix, where documents are
always elementary contexts corresponding to the context units (i.e.
fragments, sentences, paragraphs) in which the corpus has been
subdivided into;
b - data analysis by a probabilistic model which uses the Latent
Dirichlet Allocation and the Gibbs Sampling (see the related
information on Wikipedia: http://en.wikipedia.org/wiki/Latent_Dirichlet_allocation;
http://en.wikipedia.org/wiki/Gibbs_sampling;
c - description of themes by means of the probability of their
characteristic words, either specific
or shared by two or more
themes.
On completion of the analysis you can easily perform the
following operations:
1 - explore the characteristics of each theme;
2 - explore the relationships between the various
themes;
3 - rename or discard specific themes;
4- assess the semantic coherence of each theme;
5 - test the model and assign context units (i.e.
documents and/or elementary contexts) to themes;
6 - apply the model by creating a new thematic variable,
the values of which are the chosen topics;
7 - export a dictionary of categories, which can be used
in further analyses.
In detail:
1 - Explore the characteristics of each
theme
An overview of all themes is the first output which can
be checked and saved, and it can be easily re-accessed by using the
'Preview' button (see below).

Other kinds of outputs are accessible by choosing the
options highlighted in the below picture.
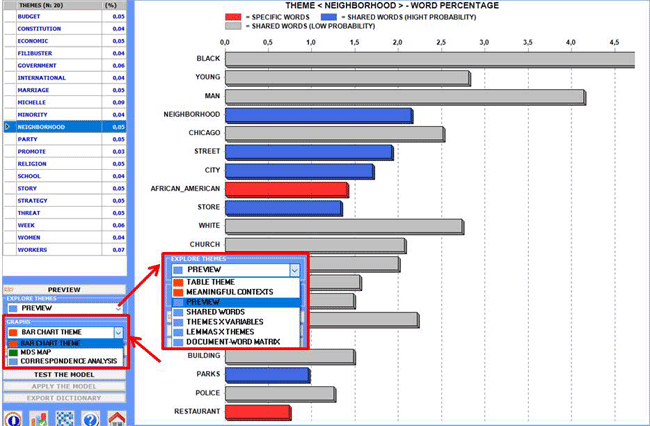
N.B.: In the above chart 'high probability' indicates a
probability >=.75.
When a topic is selected, by clicking the 'table theme'
option, you can check its characteristics and - by clicking on any
word in the table - a remove option
becomes available (see the below picture).
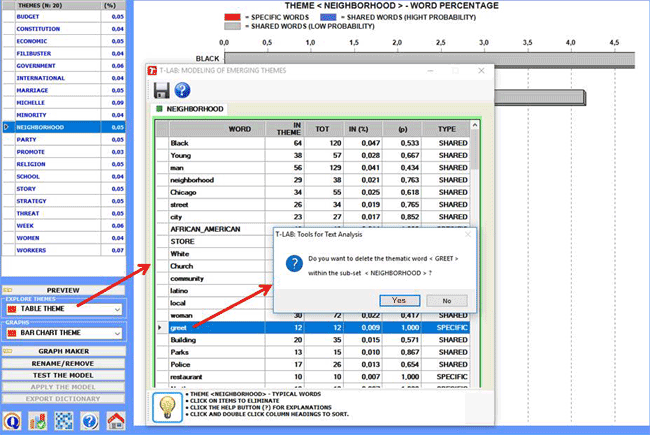
The reading keys of the above table are as follows:
IN THEME = tokens of each word within the selected theme;
TOT = total tokens of each word within the corpus (or the subset)
analysed;
IN (%) = percentage values of each word within the selected
theme;
(p) = probability value of each word over themes;
TYPE = specific when the word belongs
to the selected theme only (i.e. p=1); shared in the other cases.
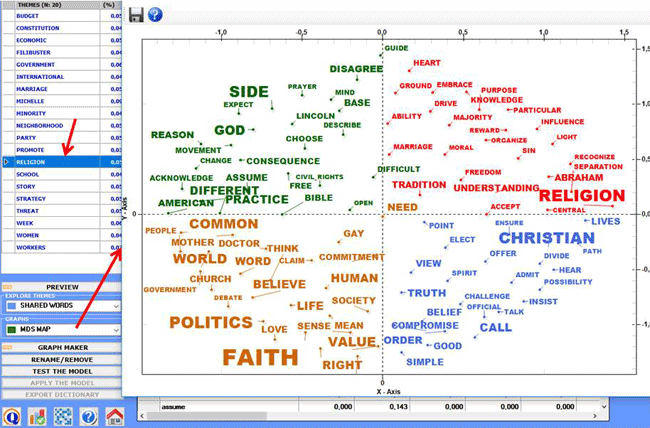
When a topic is selected, by clicking the 'MDS Map' option, the semantic relationships
between its most characteristic words can be easily explored (see
the below picture).
Moreover, by using the 'Graph
Maker' tool, more graphic options become available (see the
below pictures).
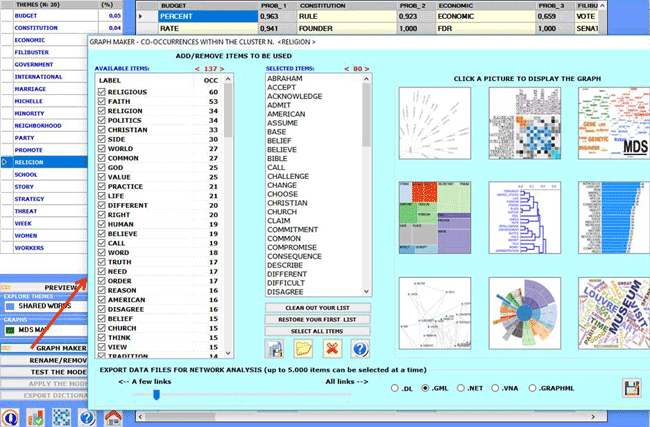
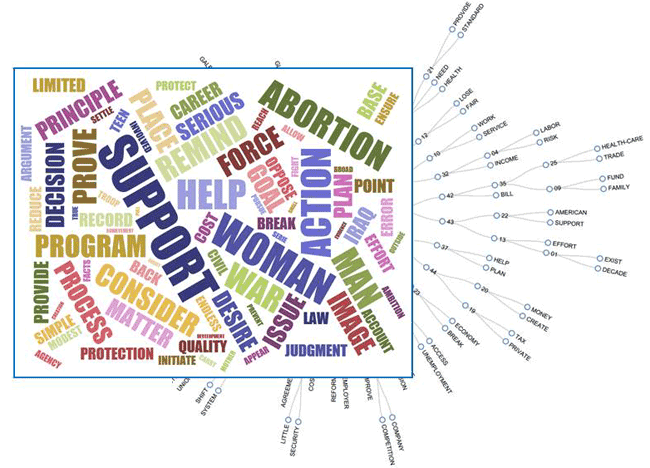
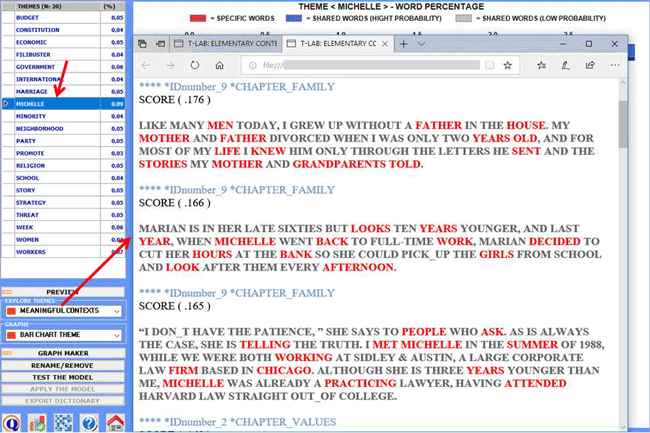
When a topic is selected, by clicking the 'meaningful
contexts' option, a HTML file is created where the top 20 text
segments - which most closely match the topic characteristics - are
displayed (see the below picture).
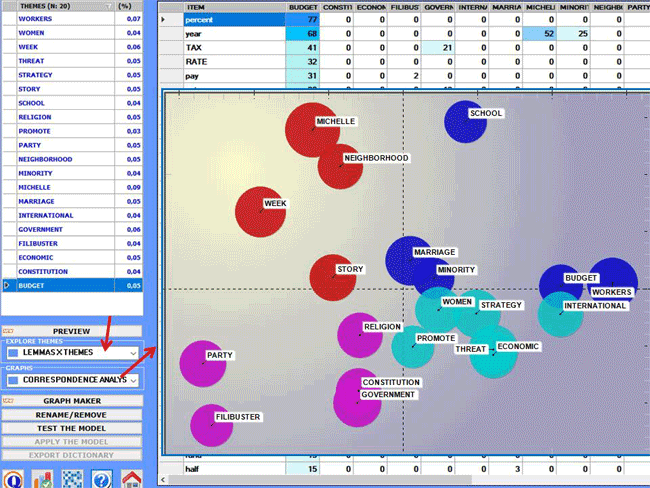
2 - Explore the relationships between the
various themes
Two kinds of contingency tables can be created and explored through
the Correspondence Analysis tool:
2.1) a word per topic table (see below)
2.2) a topic per variable table (N.B.: In the below chart
the nine bubbles correspond to the chapters of one of Obama's
book)
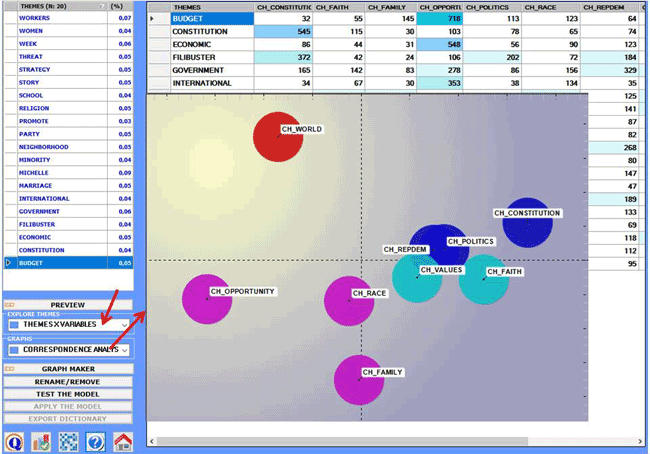
Two more graphic options are available which allow us to
map the relationships between the various topics/themes:
2.3) a MDS Map
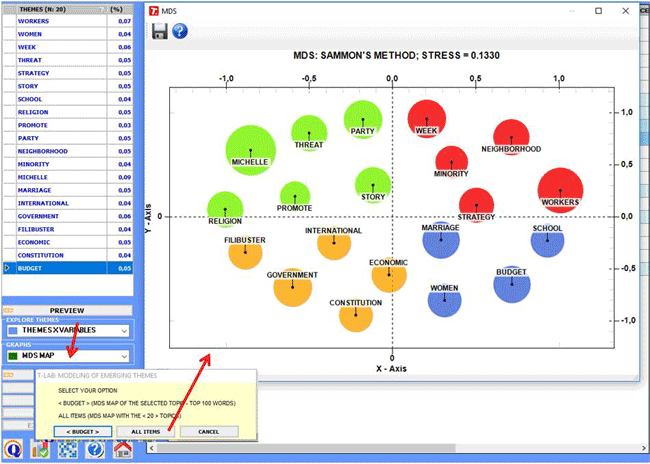
2.4) a Network Graph obtained by exporting/importing the
adjacency table created by T-LAB (see below)
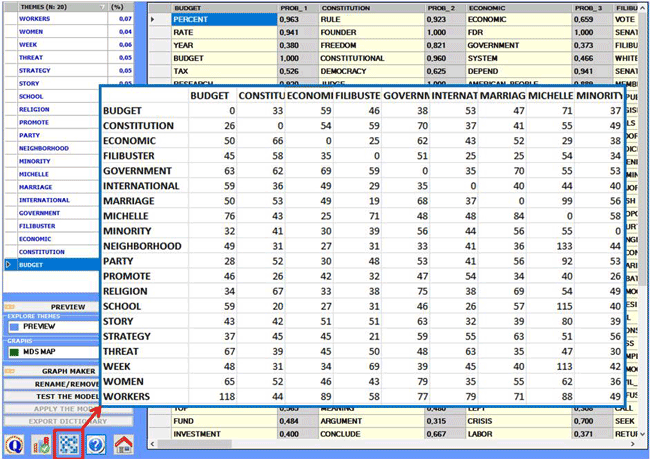
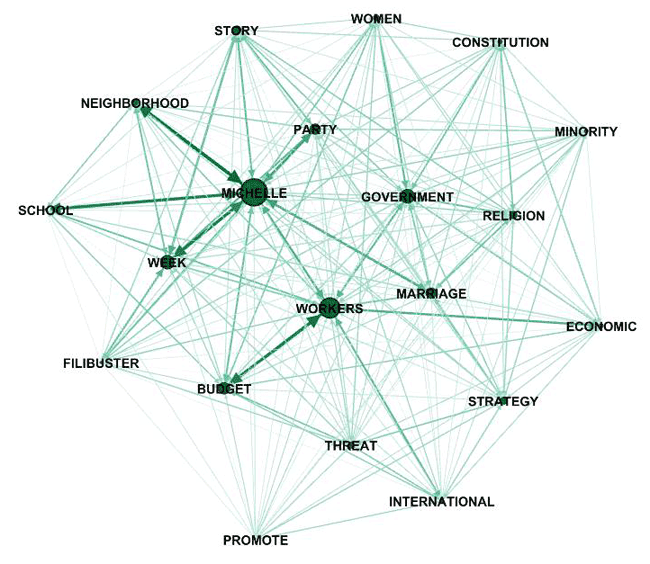
N.B.: The above graph has been created by means of Gephi
(https://gephi.org/ ), which is an open source software, after
importing a table created by T-LAB.
3 - Rename or discard specific
themes
In order or discard specific themes, just select one of them (see
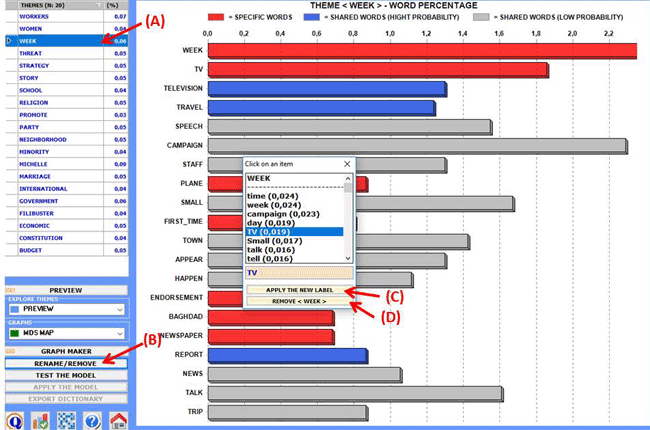
"A" below) and click on the "rename/remove" button (see "B" below).
When the appropriate box appears, depending on your goals, you can
change the label by choosing among the available words or by typing
a new label in the appropriate field (see "C" below); otherwise you
can discard the selected theme just by clicking on the
corresponding button (see "D" below).
4 - Assess the semantic coherence of each
theme

When clicking the Quality
Indices button (see the picture above), T-LAB computes the average similarity between
the top 10 words of each theme.
More specifically:
- the top 10 words are those with the highest probability values
over themes;
- the average similarity is computed using the cosine index;
- the cosine index of each word pairs, like the Word Associations tool, is computed at the text
segment (i.e. elementary context) level .
As a result, T-LAB creates a HTML table where the 'k' themes are
listed according to their 'semantic coherence' (i.e. the first
theme in the list is the one with the highest average similarity
index).
N.B.: Because the above measures vary according to the selected
words, the user is advised to repeat the procedure each time any of
the top 10 words of each theme is removed.
5 - Test the
Model
At the end of the analysis procedure (see above the "a" and "b"
points) each context unit (i.e. primary documents or elementary
contexts) is represented as mixture of different topics;
differently the classification process used in this step assigns
each context unit to the topic which is the most characteristic of
it.
For this reason, when the "Test the
Model" option is selected, T-LAB
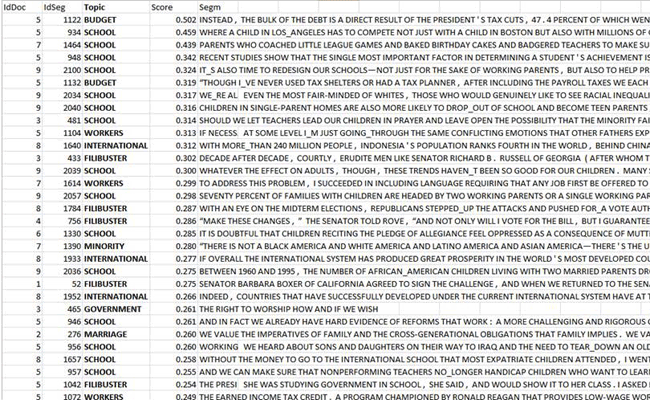
creates two files including the classification of contexts units
(see below).

For In the above table, each document has a probability
value associated with each topic.
6 - Apply the model
After having applied and
saved the model, given that after exiting from the
analysis (see "B" above) themes are recorded as clusters of context
units (i.e. like the Thematic Analysis of
Elementary Contexts and Thematic
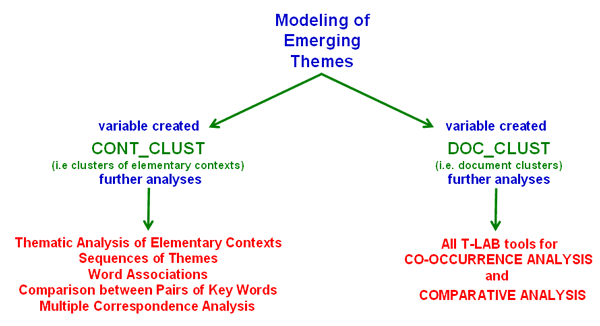
Classification of Documents results), the new thematic
variables just created (i.e. CONT_CLUST and/or DOC_CLUST) can be explored by using various
T-LAB
tools (see below).
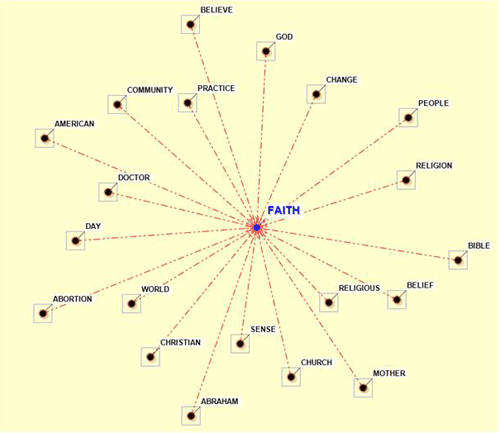
For example, by using the Word
Associations tool and by selecting the sub-set (i.e. topic)
'Religion' the following graph can be created.
7 - Export a dictionary of
categories
When this option is selected a dictionary file with the
.dictio extension is created which is
ready to be imported by any T-LAB tool for thematic analysis. In such a
dictionary each theme (or category) is described by its
characteristic words.
|