|
|
T-LAB 10.2 - ON-LINE HELP |
|
|
www.tlab.it
Thematic Analysis of Elementary Contexts
This T-LAB tool allows you to obtain and explore a representation of corpus contents through few and significant thematic clusters (from 3 to 50), each of which: a) consists of a set of elementary
contexts (i.e. sentences, paragraphs or short texts like
responses to open-ended questions) characterized by the same
patterns of key-words; In many ways, analysis results can be considered as an isotopy (iso = same; topoi = places) map where each of them, as generic or specific theme (Rastier, 2002: 204), is characterized by the co-occurrences of semantic traits. The analysis process can be performed through an unsupervised clustering (i.e. bottom-up approach), which is the default option, or a supervised classification (i.e. top-down approach). When choosing the latter (i.e. supervised classification), a dictionary of categories must be imported, either created by means of a previous T-LAB analysis or made up by the user.
A T-LAB
dialog box (see above) allows the user to set some analysis
parameters.
In the case of unsupervised clustering (default option), the analysis procedure consists of the following steps: a - construction of a data table context units x lexical
units (up to 300,000 rows x 5,000 columns), with presence/absence
values; N.B.: Starting from T-LAB Plus 2016, the unsupervised
clustering of the context units (see step 'c' above) can be
performed either by using the bisecting K-means algorithm (1) or by
using a not centered version of PDDP (i.e. Principal Direction
Divisive Partitioning) proposed by D. Boley (1998) for selecting
the seeds of each K-means bisection. This procedure therefore performs a type of co-occurrence analysis (steps a-b-c) and, subsequently, a type of comparative analysis (steps e-f-g). In particular, comparative analysis uses the categories of the "new variable" derived from the co-occurrence analysis (categories of the new variable = thematic clusters) to form the contingency table columns. In the case of supervised
classification the steps of comparative analysis are the
same (see e-f-g above), whereas co-occurrence analysis is performed
as follows: N.B.: When the user decides to repeat/apply the results
of a previous analysis (i.e. a Thematic
Analysis of Elementary Contexts or a Modeling of Emerging Themes), T-LAB performs a comparative analysis only
(steps e-f-g). In details: 1 - Explore the
characteristics of the clusters
In the case of the chi square test the structure of the analysed table is the following:
Where: An HTML report (see below) is generated to permit detailed analysis of the cluster characteristics. In the report, in addition to the list of typical words, the most characteristic elementary contexts of the selected cluster are shown in descending order according to their respective score.
Pie charts and bar charts are used to verify the percentage of context units (i.e. elementary contexts) that belong to each cluster.
2 - Explore the relationships between the clusters Some of the graphs obtained by Correspondence
Analysis enable you to explore the relationships between
clusters in bidimensional spaces.
All the graphs can be maximized and customized by using the appropriate dialog box (just right click on the chart). Moreover, when thematic clusters are 4 or more, their relationships can be explored through 3d moving (see below).
Moreover, for every factorial axis, T-LAB
supplies tables that facilitate the interpretation.
By selecting the Complete Results option it is possible to check all the results of the Correspondence Analysis lexical units x clusters.
A specific option (see
below) allows us to visualise/export the contingency table and to
create charts showing the distribution of each word within the
clusters and their corresponding chi-square value. N.B.: Such a table includes
both active ('A') and supplementary ('S') key-words.
3 - Explore the relationships between clusters and variables Bar charts allow you to verify the relationships between clusters and variables.
You can explore additional relationships between clusters and variables using the functions provided in the Factor Analysis section (see above). 4 - Explore the various cluster partitions Because the algorithm used (bisecting K-means) produces a hierarchical clustering, the user can explore various analysis solutions: partitions from 3 to 50 clusters. For each partition obtained, a specific table (see
below) lists the following values: The Partition option allows you to easily explore the characteristics of the available clustering solutions (just click on a table item).
Moreover the dendrogram option (see below) allows two possibilities: a) to check the tree structure of the various bisections;
b) to check the tree with the characteristic words of each cluster.
5 - Refine the results of the chosen partition After having explored different solutions, the user can refine the results of the chosen partition and, if necessary, repeat some of the three operations above illustrated. For this purpose two methods are available (see the picture below):
When the 'A' method
(i.e. Naïve Bayes Classifier) is
chosen, this step allows the user to delete from the analysis all
context units of which cluster membership doesn't fit either of the
following criteria: Whereas, in the case of 'B' method (i.e. Reclassification Based on Typical Words) T-LAB considers the cluster characteristics - i.e. the words with a significant Chi-Square value - like items of a category dictionary and performs the three steps of 'supervised classification' described at the beginning of this section. So, when the user is interested in re-using dictionaries and in comparing the analysis results, this method is highly recommended. All the results of this computation are in the following
table exported by T-LAB
(see below), where the posteriori values for each cluster are in
percentage format.
6 - Assign labels to the clusters A specific T-LAB
function allows you to assign labels to clusters.
Labels assigned to clusters can be displayed in the various graphs available (see below).
7 - Verify which elementary
contexts belong to each cluster
In fact the Cluster Membership button lets you export three types of tables (see below) in MS Excel format: a - "Cluster_Partitions.xls" listing all the context unit correspondence for each cluster within the various partitions;
In particular, the relevance value (Score) assigned to each elementary context (j) belonging to the cluster (k) comes from the following formula:
Where: c - "Ec_Document_Classification.xls" (only provided when the corpus is made up of at least 2 primary documents at least and when they are not short texts like responses to open ended questions) listing the mixed cluster membership of each document (see below).
10 - Save the selected partition for exploration with other T-LAB tools When you exit the Thematic Analysis of Elementary Contexts function, the software displays messages to remind you that you can use other T-LAB tools to explore the clusters obtained.
If you select Save, the < CONT_CLUST > variable (clusters of elementary contexts) remains available only for certain types of analysis (e.g. Sequences of Themes, Word Associations, Comparison between Pairs of Key-Words, Co-Word Analysis and Concept Mapping) and until the user modifies his word list. 11 - Export a dictionary of categories When this option is selected, T-LAB allows the user to create two files: - a dictionary file with the .dictio extension which is ready to be imported by any T-LAB tool for thematic analysis. In such a dictionary each cluster is a category described by its characteristic words, i.e. by all words with a significant Chi-Square value within it; - a MyList.diz file ready to be imported via the Customized Settings tool. Since this file contains a list of all words with a significant chi-square value (i.e. all words that determine the differences between thematic clusters), its use may allow the user to repeat some analyses in a 'more selective' way.
12 - Validate the chosen partition and assess the semantic coherence of each theme
When clicking the Quality
Indices button (see the picture above), T-LAB
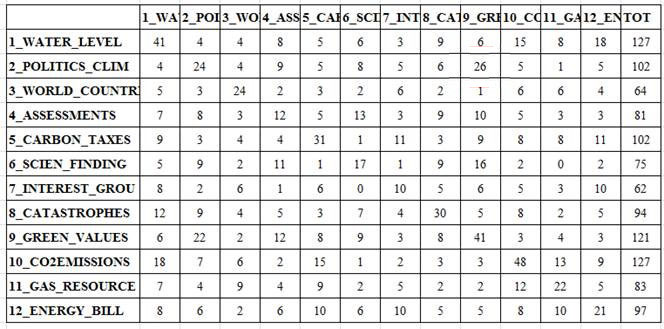
creates a HTML file listing various measures. 13 - Sequences of Themes Unlike the Sequences of Themes tool included in the co-occurrence analysis sub-menu, this one has been specifically designed to complement the thematic analysis of elementary contexts. More specifically its use makes sense only when the entire corpus can be considered like a discourse and/or its various sections (e.g. chapters of a book, parts of an interview, turns in a conversation or a debate, etc.) follow each other in a temporal order. In fact this tool deals with the relationships between elementary contexts (up to 100,000) along the linear chain of the corpus, by considering each of them - either predecessor or successor - as an analysis unit belonging to a thematic cluster (or as unclassified). Accordingly, all available outputs allow the user to explore sequential relationships between 'themes', either by means of static charts and tables or by means of animated charts showing changes over time. This way the user can check either when people are engaged in specific themes (e.g. by looking at a diagonal of the matrix below) or when they shift from a dominant theme to another. Step by step, here is a short description of how to proceed. (N.B.: All the following outputs refer to a thematic analysis of the book The Politics of Climate Change by Antony Giddens published in the T-LAB website). When the Sequence of themes button is enabled, by clicking it the following 'player' becomes visible and active in the T-LAB working window.
Option '1' (see matrix / space above) refers to the type of chart for visualizing theme sequences, either within the entire corpus or within a part of it (see option 2 above). When checking 'matrix', a 3d chart is available which summarizes the relationships between predecessors and successors. In this case, while exploring 3d animated charts the bar dimensions are continuously readjusted to indicate how the occurrences of each sequence (i.e. two way relationship between a 'predecessor' and a 'successor') increases (see below).
When checking the 'space', a 2d scatter chart is available which summarizes both the dimensions (i.e. percentages) and the relationships between thematic clusters. In this case, while exploring 2d animated charts the bubble dimensions - which are continuously readjusted to a total equal to 100% - indicate how the percentage of each thematic cluster changes over time; meanwhile the moving arrows indicate how themes follow each other (see below).
Moreover, at each step - after stopping the video (see the 'pause' button) - it is possible to obtain two further outputs: A - html tables which summarize the relationships between predecessors and successors (see below);
B - graph files which can be imported by software for network analysis.
N.B.: The above graph, which refers to the third chapter
of Giddens' book (i.e. 'The Greens and After') has been created by
means of Gephi (see https://gephi.org/).
.
|