|
www.tlab.it
Correspondence
Analysis
 N.B.: The pictures shown in this section have been obtained by
using a previous version of T-LAB. These pictures look slightly different
in T-LAB 10. Moreover: a) there
is a new button (TREE MAP PREVIEW)
which allows the user to create dynamic charts in HTML format; b)
by right clicking on the keyword
tables, additional options become available; c) two new buttons
allows us to check the specificities of each variable values either
by using the chi-square test or the
test value; d) a new button allows the user to carry out a cluster analysis that uses the coordinates of
the objects (i.e. either lexical units or context units) on the
first factorial axes (up to a maximum of 10); e) a quick access
gallery of pictures which works as an additional menu allows one to
switch between various outputs with a single click. .
N.B.: The pictures shown in this section have been obtained by
using a previous version of T-LAB. These pictures look slightly different
in T-LAB 10. Moreover: a) there
is a new button (TREE MAP PREVIEW)
which allows the user to create dynamic charts in HTML format; b)
by right clicking on the keyword
tables, additional options become available; c) two new buttons
allows us to check the specificities of each variable values either
by using the chi-square test or the
test value; d) a new button allows the user to carry out a cluster analysis that uses the coordinates of
the objects (i.e. either lexical units or context units) on the
first factorial axes (up to a maximum of 10); e) a quick access
gallery of pictures which works as an additional menu allows one to
switch between various outputs with a single click. .
Some of these new features are highlighted in the below
image.
This T-LAB tool
highlights the similarities and the
differences between context units.
More precisely, in T-LAB, correspondence
analysis can be applied to three kinds of tables:
(A) tables of words
by variables with occurrence values;
(B) tables of elementary contexts by words with co-occurrence values;
(C) tables of documents by
words with co-occurrence values;
In order to analyse occurrence tables (A), the corpus should be made up of a
minimum of three texts or should be codified with some variables
(not less than three categories).
The
variables are listed in an appropriate box and can be used one at
time.
After every selection - in sequence - the contingency table is
dispalyed and T-LAB asks us to click on the analyse button (see below).
The analysis results allow the drawing of graphs in which
the relationships between both the corpus subsets and the lexical
units that make them up are represented.
More
precisely, depending on the case, the types of graphs available
show the relationships between active
variables, between illustrative
variables, between lemmas and
between lemmas and variables (see below).
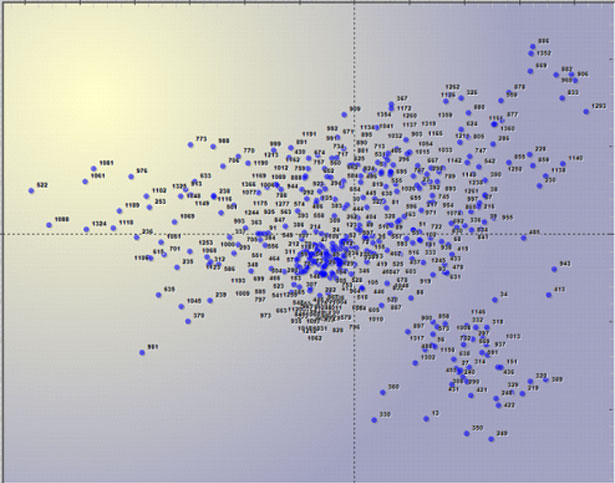
Moreover, when analysing a document by word table, it is
possible to visualize the points (Max 3,000) corresponding to each
document (see below).
All the graphs can be maximized and customized by using
the appropriate dialog box (just right click on the chart).
Moreover, when variable categories are 3 or more, their
relationships can be explored through 3d moving (see below).
In order to explore the various combinations of the
factorial axes it is sufficient to select them in the appropriate
boxes ("X Axis", "Y Axis").
In T-LAB the characteristics of each factorial pole (i.e. the opposites on the
horizontal and vertical axes) are shown using the Absolute Contributions, the threshold value of which is 1/N (in
this case, N = rows of contingence tables), and the Test Values, the threshold value of which is +/-
1.96.
The eigenvalue chart enables the evaluation of the
relative weight of each factor, that is the percentage of variance
explained by each one of them.
A click on the button "Complete Results" enables the user
to visualize and export a file that contains all the results of the
analysis: eigenvalues, coordinates, absolute and relative
contributions, and test values.
All contingency tables can be easily exported and allow us to
create various charts.
Moreover, by clicking on specific cells of the table (see below),
it is possible to create a HTML file
including all elementary contexts where the word in row is present
in the corresponding subset.
In the case of tables (B) and (C)
(see above), they consist of as many rows as there are context
units (max. 10,000) and as many columns as there are selected key
words (max. 3,000).
The calculation algorithm and the outputs are similar to those of
the analysis of lexical unit by variable tables, except that - in
this case - in order to cut down processing time, In
T-LAB the limits itself
to the extraction of the first 10 factors, which is a more than
sufficient number in order to summarize the variability of the
data.
Moreover,subsequently it is possible to carry out a
Cluster Analysis.
|


