|
www.tlab.it
Singular Value
Decomposition
The Singular Value Decomposition (SVD - see
Wikipedia https://en.wikipedia.org/wiki/Singular-value_decomposition)
is a technique for dimensionality reduction, which - in Text Mining
- can be used for discovering the latent dimensions (or
components) which determine semantic similarities between
words (i.e. lexical units) or between documents (i.e. context
units).
T-LAB allows us to
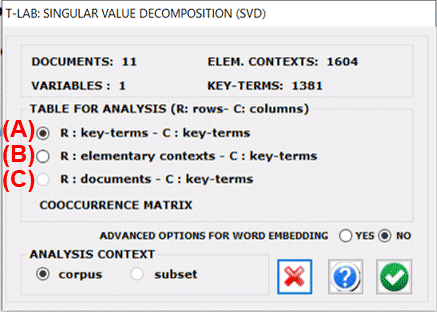
perform a Singular Value Decomposition of three types of
data tables. In the first case (see 'A' below), the data table
is a co-occurrence matrix whose rows and columns are key-terms. In
the second case (see 'B' below), a data table elementary contexts x
key-terms will be filled with presence/absence values (i.e. '1' and
'0'). In the third case (see 'C' below), a data table documents x
key-terms will be filled with occurrence values.
N.B.: Please note that, when analysing co-occurrence
matrix whose rows and columns are key-terms (see 'A' below),
T-LAB provides high-quality
dense vectors (i.e. word embeddings).

The analysis procedure consists of the following
steps:
1 - construction of the data table to be analysed (up to 300,000
rows x 5,000 columns);
2 - TF-IDF normalization and scaling of row vectors to unit length
(Euclidean norm);
3 - extraction of first 20 'latent dimensions' through the Lanczos
algorithm.
N.B.:
- In the case of co-occurrence matrix (see 'A' above), data
normalization is performed through the cosine measure.
- When the advanced options for word embedding
are selected, T-LAB computes PPMI values (Positive Pointwise Mutual
Information) and makes it possible to use the first 50 dimensions
of the SVD.
The analysis results are displayed in tables and
charts.
In detail:
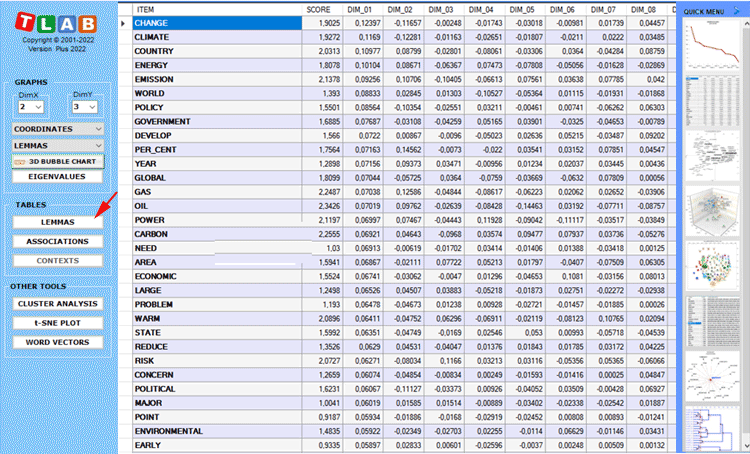
Two tables - the rows of which can be either lexical units
or context units - have as many columns as the extracted
dimensions.
In the case of the LEMMAS (i.e. lexical units) table, a
further column is displayed, in which the importance scores are
reported (see below).

N.B.: The importance score of each lemma is
computed by summing the absolute values of its first 20 coordinates
(i.e. the eigenvectors), each one multiplied by its corresponding
eigenvalue.

Any table can be sorted in ascending or descending
order by clicking on any column header.
In order to export any table, just use the right click of
the mouse when data are displayed.
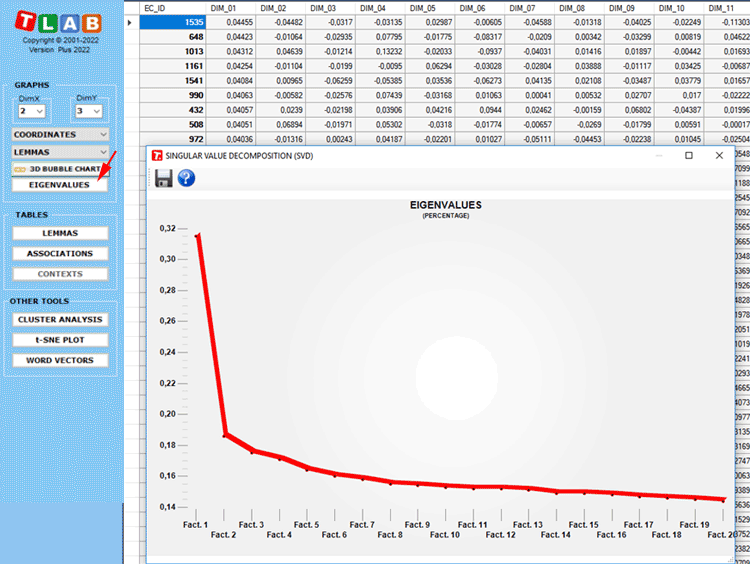
Please note that, the first time such a table is exported, the
Eigenvalues are also exported. This way the user is allowed to
evaluate the relative weight of each dimension, that is the
percentage of variance explained by each one of them.
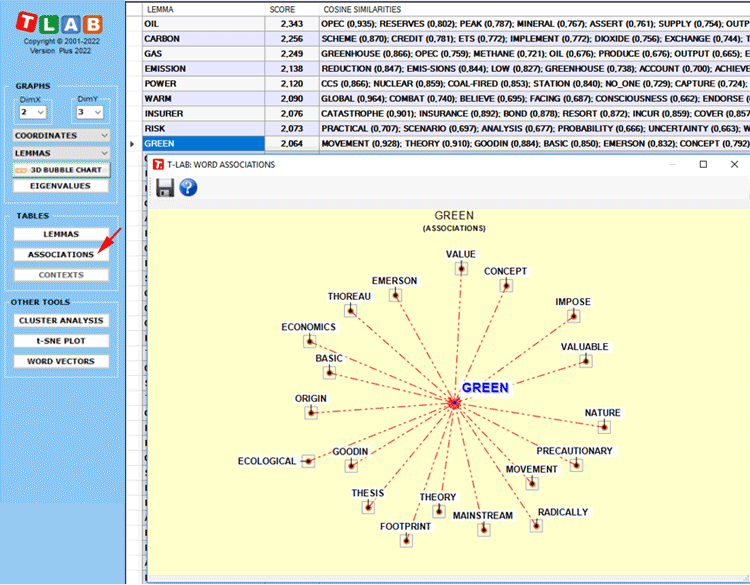
By clicking the Associations button (see below), a
further table is displayed with the similarity measures (i.e.
cosine coefficients) of each word. Moreover, when any row of such a
table is clicked, a graph is displayed with the corresponding
data.

The main charts shows the relationships between
the key-terms (i.e. lemmas) on the selected dimensions (see
below).

By default, the above chart includes the 100 most
important lemmas. However the user is allowed to customize both the
number of lemmas and the chart characteristics.
|