|
www.tlab.it
Cluster Analysis
 N.B.: The pictures shown in this section have been obtained
by using a previous version of T-LAB. These pictures look slightly different
in T-LAB 10. Also: a) there is
a new button (TREE MAP PREVIEW) which
allows the user to create dynamic charts in HTML format; b) the
DENDROGRAM button has been replaced by the Graph Maker tool; c) a quick access gallery of
pictures which works as an additional menu allows one to switch
between various outputs with a single click (see the below
image). N.B.: The pictures shown in this section have been obtained
by using a previous version of T-LAB. These pictures look slightly different
in T-LAB 10. Also: a) there is
a new button (TREE MAP PREVIEW) which
allows the user to create dynamic charts in HTML format; b) the
DENDROGRAM button has been replaced by the Graph Maker tool; c) a quick access gallery of
pictures which works as an additional menu allows one to switch
between various outputs with a single click (see the below
image).
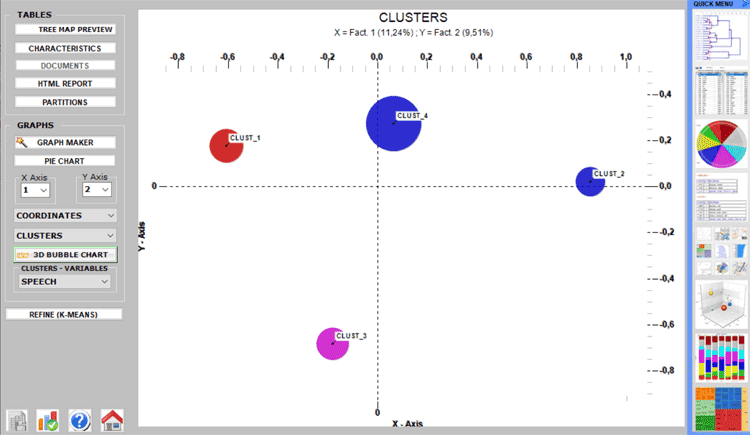
This T-LAB tool uses the results of a
previous Correspondence Analysis; in
particular, the computation uses the object coordinates (lexical
units or context units) on the first factorial axes (until a
maximum of 10).
Accordingly, the user can
select from three clustering techniques:
a) hierarchical (Ward method);
b) K-means (MacQueen method);
c) hdbscan (hierarchical DBSCAN).
The first two (a, b) allow the user to explore (tables and
graphs) solutions from 3 to 20 clusters; while the third (c), which
requires an additional parameter (i.e. the minimum number of words
within a cluster), allows the user to explore just one
solution.
N.B.: When the hierarchical method is select T-LAB
enables an option (see the 'Refine' button below) that allows
the user to combine the Ward and K-Means methods.
A brief description of the three techniques is available in the
glossary of this manual.
At the processing end, T-LAB
shows graphs and tables.
The graphs represent clusters in the space detected by the
correspondence analysis (see below)
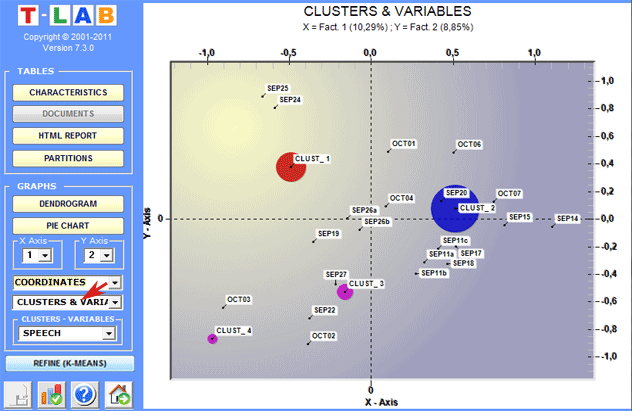
In order to explore the various combinations of the
factorial axes it is sufficient to select them in the appropriate
boxes ("X Axis", "Y Axis").
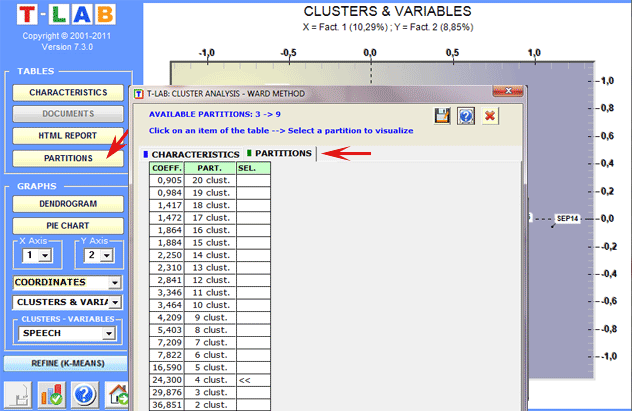
In the case of hierarchical clustering, the user
can easily explore (graphs and tables) the different
partitions.
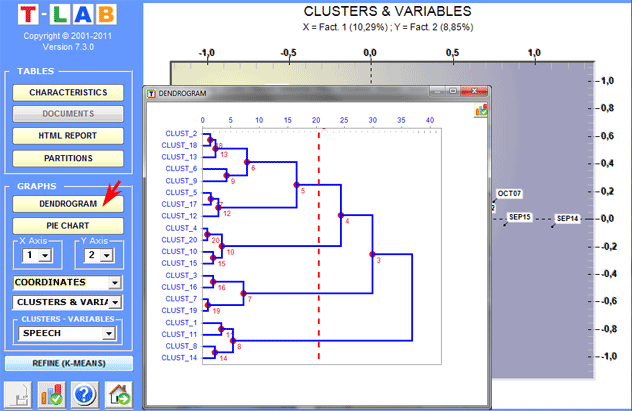
Dendrograms, pie charts and bar charts allow us to
check the characteristics of each partition.
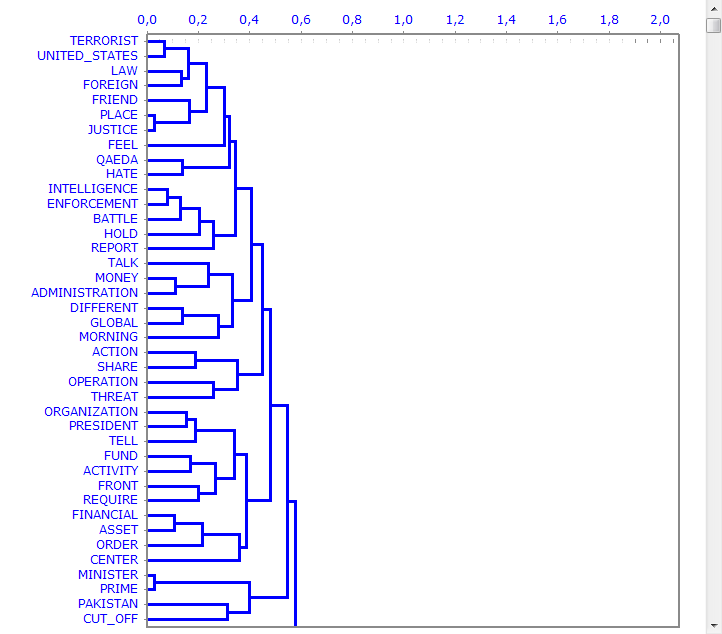
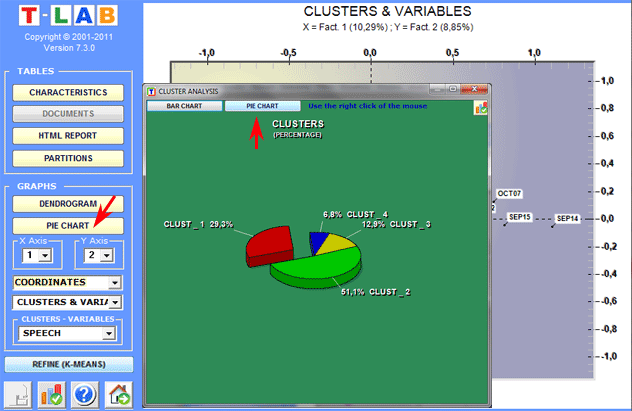
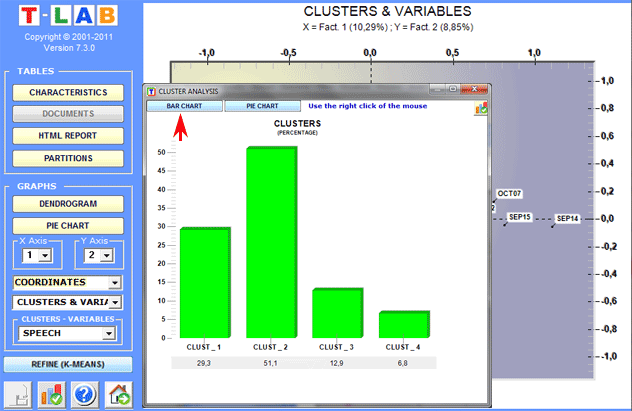
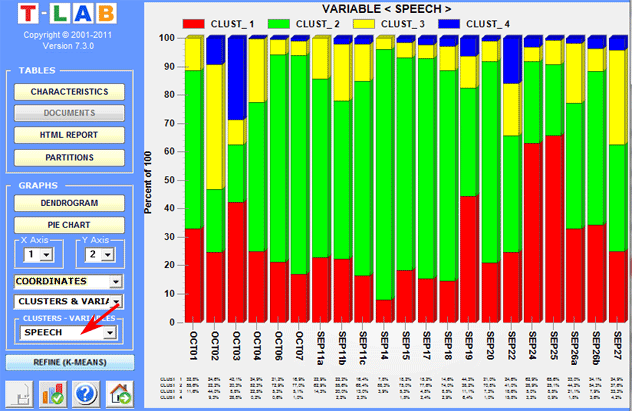
Bar charts allow us to check the relationships
between clusters and variables.
Two kinds of tables are available:
(A) if the clustered objects are lexical units, for each of
them (and for each cluster) the respective occurrences ('OCC') and
distances ('DIST') from the centroids are displayed; moreover, for
each variable which is significantly associated with the cluster
examined, the respective Test Value is
displayed.
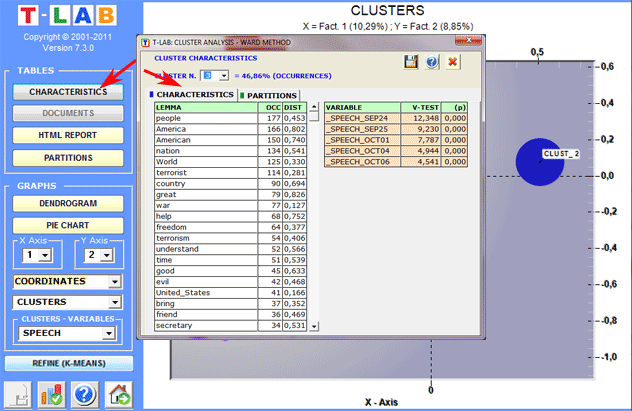
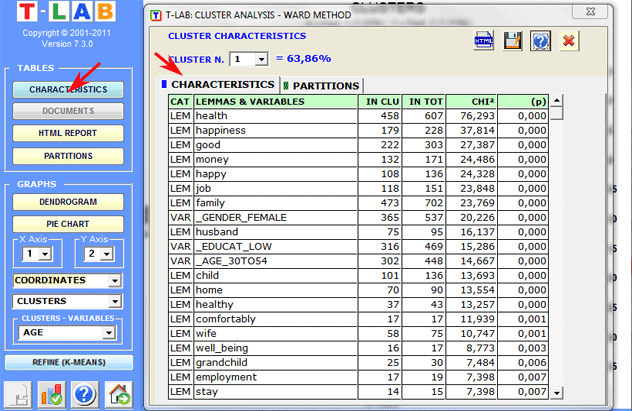
(B) if the
clustered objects are elementary contexts,
the characteristics of each cluster (lexical units and variables)
are described by means of the same method used in
Thematic Analysis of
Elementary Contexts (see below).
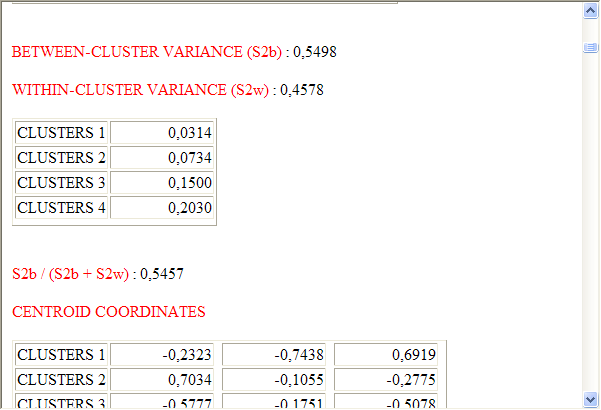
In the case of analyses performed using the
hierarchical or K-means methods, T-LAB
allows the user to view and to export a file (see "HTML
Output" key) in which the characteristics of the clusters and some
measures relating to the quality of the partition are
reported.
|