|
www.tlab.it
Sequence and Network
Analysis
This T-LAB tool, which takes into account
the positions of the various lexical units relative to each other,
allows us to represent and explore any text as a
network.
Various options are available which can be used
both for performing a Co-Word Analysis and a Thematic
Analysis, as well as Disambiguation tasks.
In fact, after building two matrices in which all
pairs of predecessors and successors are recorded, T-LAB
calculates the transition probabilities (markov chains) and
provides various outputs concerning the target words.
Moreover, it is possible to perform a cluster analysis of
the network data and explore the semantic relationships between
words either within or between the various 'thematic clusters'. To
this purpose, the Louvain method for community detection is used
(see Blondel V.D., Guillame J.-L , Lambiotte R., Lefebre E., 2008;
; N.B.: In T-LAB, the analised network consists of
directed and weighted links).
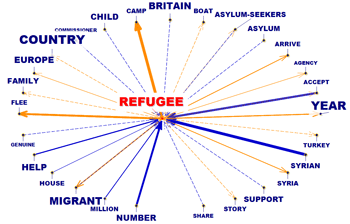
That means that the user is allowed to check the
relationships between the 'nodes' (i.e. the key-terms) of the
network at different levels: a) in one-to-one connections; b) in
the 'ego' network; c) within the 'communities' to which they
belong; d) within the entire text network.
|
ONE-TO-ONE
|
EGO-NETWORK
|
|
|
|
COMMUNITIES
|
ENTIRE NETWORK
|
|
|
The information concerning how to use the above
options is organized in three sections:
A - Exploring one-to-one connections and 'ego'
networks;
B - Exploring 'communities' (i.e. thematic clusters) and the entire
network;
C - Some technical details.
A - EXPLORING ONE-TO-ONE CONNECTIONS AND 'EGO'
NETWORKS
When the automatic analysis is over, several graphs
and tables are available which allow us to ckeck the relationships
and the data concerning target words (just click any item in the
tables or any point on the graphs).
All graphs can be customized and exported in
different formats (right click to show pop-up menu).
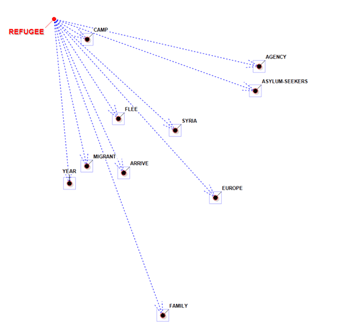
In two of graphs the items that are closer to the
selected one are those that have the higher probability of coming
before (predecessors) and after (successors).
|
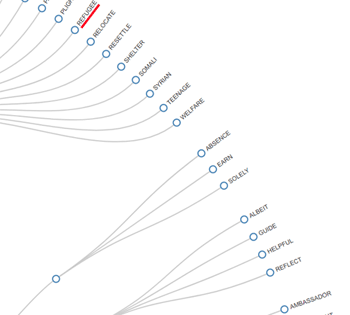
PREDECESSORS
|
SUCCESSORS
|
|
|
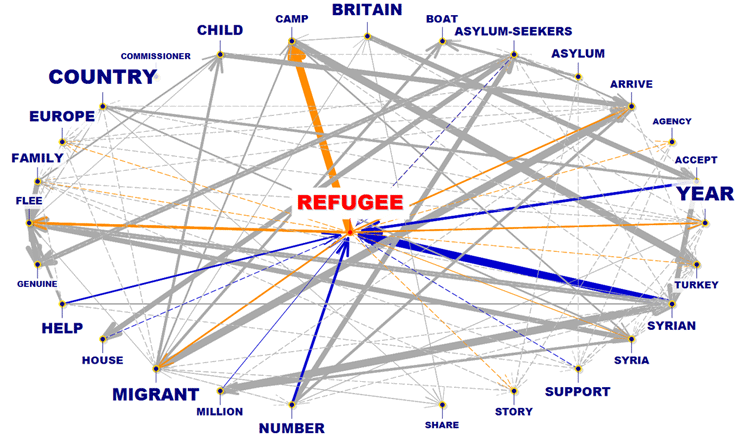
In the other cases, the closeness between key-terms
is represented by means of the arrow tickness (see below).
All data can be checked by means of various
tables.
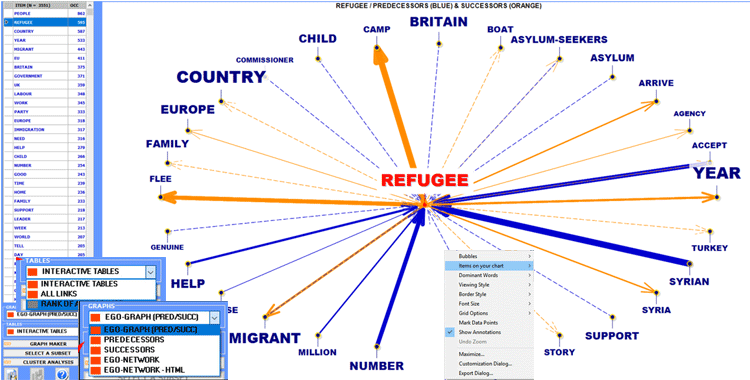
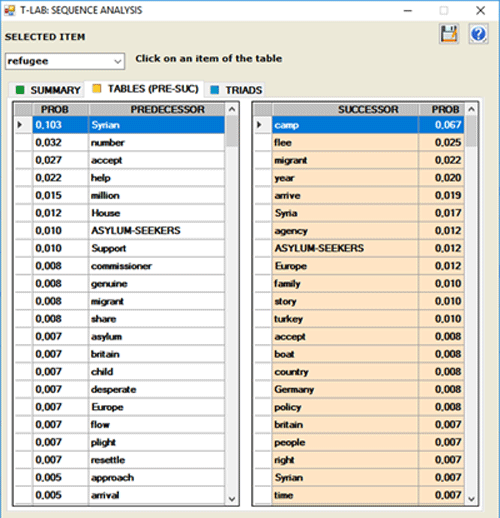
The INTERACTIVE TABLES show the sorted list
of predecessors and successors of each selected item.
The list is in descending order according to the
probability values ("PROB"). For example, in the following table,
the probability that "camp" will follow "refugee" is equal to
0.067, that is 6.7%.
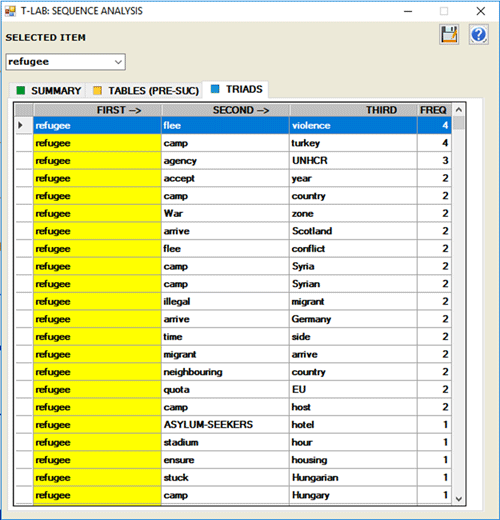
The option TRIADS (see below) allows us to
visualize some tables with sequences of three elements in which the
selected item is in the first, in the second or in the third
position. For each triad T-LAB shows the corresponding
occurrence values. (N.B.: Within the triads the empty words are not
included).
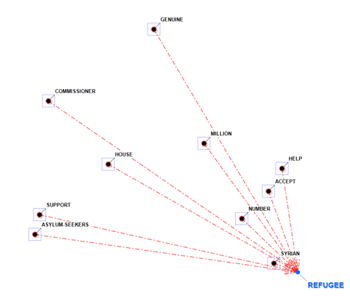
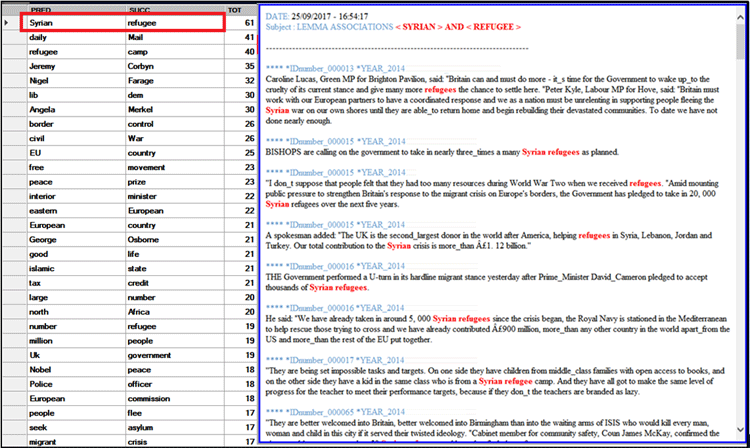
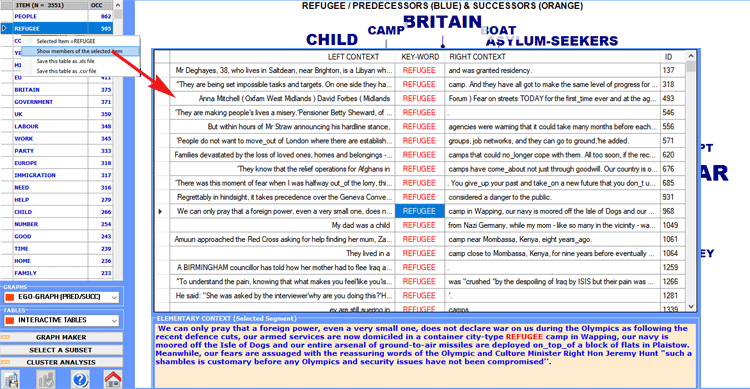
The ALL LINKS table (see below), which is
particularly useful for word-sense disambiguation, contains all
word pairs (i.e. predecessor and successor), as well as their
occurrence values. Moreover, by clicking any row of this table, all
text segments (i.e. elementary contexts) where the two members of
each pair are present at same time (i.e. co-occurrences) will be
displayed in HTML format on the right side of the form.
The RANK OF APPEARANCE table, with the
frequency and the average order of appearance (or evocation) of
each term within the text segments, is only provided when the
corpus consists of short texts, such as responses to open-ended
questions.
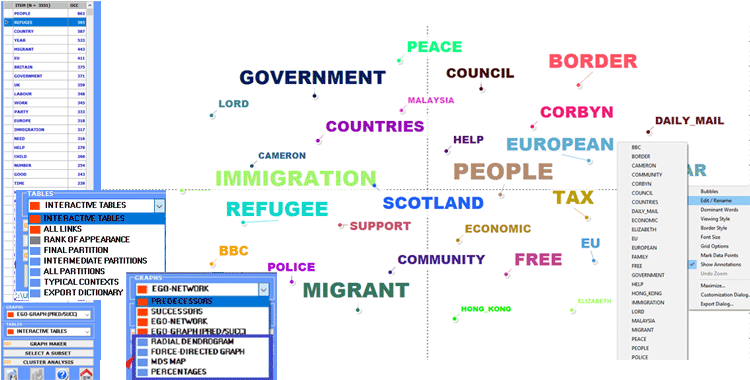
Anytime, by clicking the GRAPH MAKER option,
the user is allowed to obtain various types of graphs by using
customized lists of key words (see below)
N.B.: Experienced users who are interested in exporting files in
different formats (e.g., dl .gml .vna .graphml) with data
concerning ALL links, may click the 'SELECT ALL ITEMS'
button.
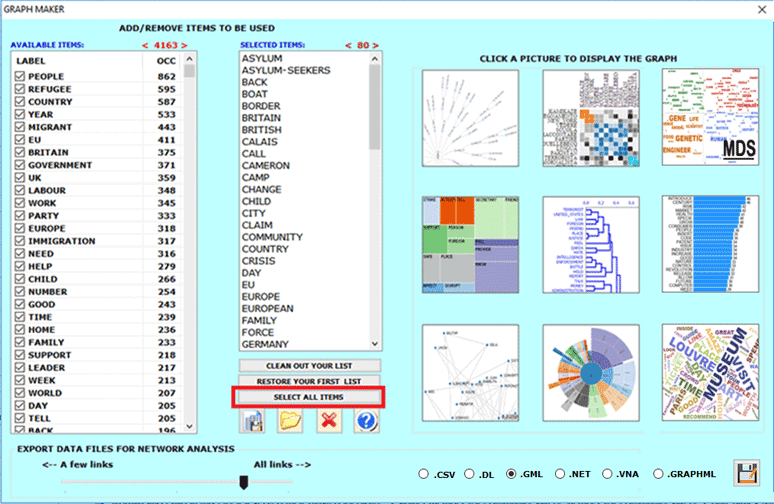
At any point, by right clicking any item on the far
left table, the user is able to check the respective concordances
(see the picture below).
B -
EXPLORING THE THEMATIC CLUSTERS AND THE ENTIRE NETWORK
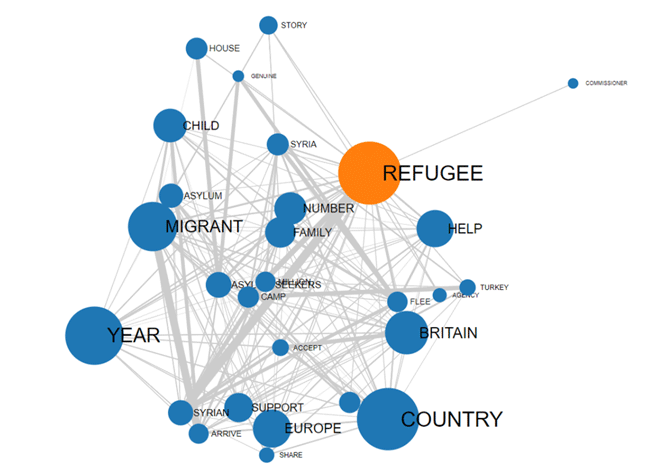
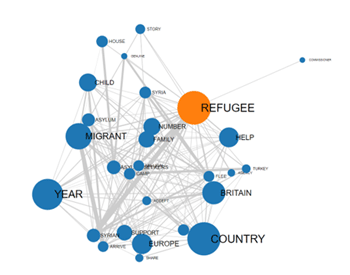
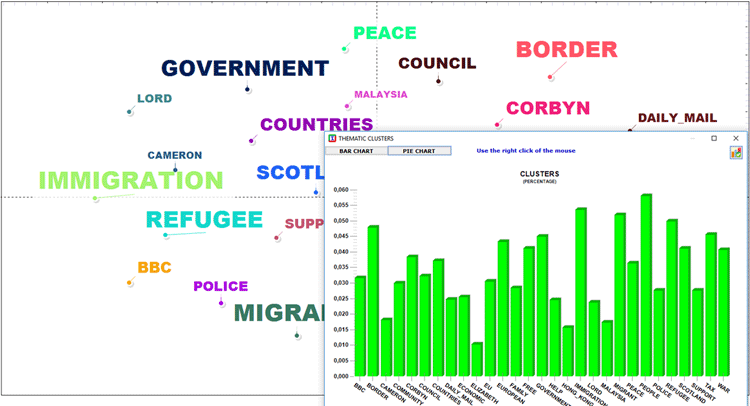
When performing a cluster analysis, further
graphs and tables become available, which allow the easy
exploration of all levels of the network hierarchy (see the items
marked with the blue rectangles in the below picture).
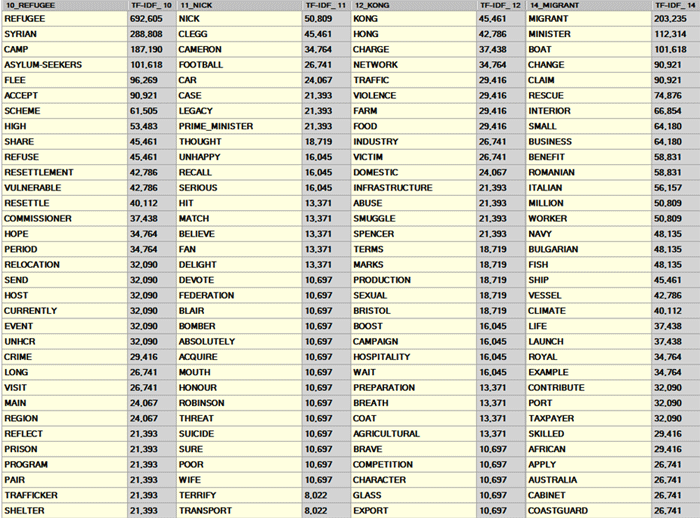
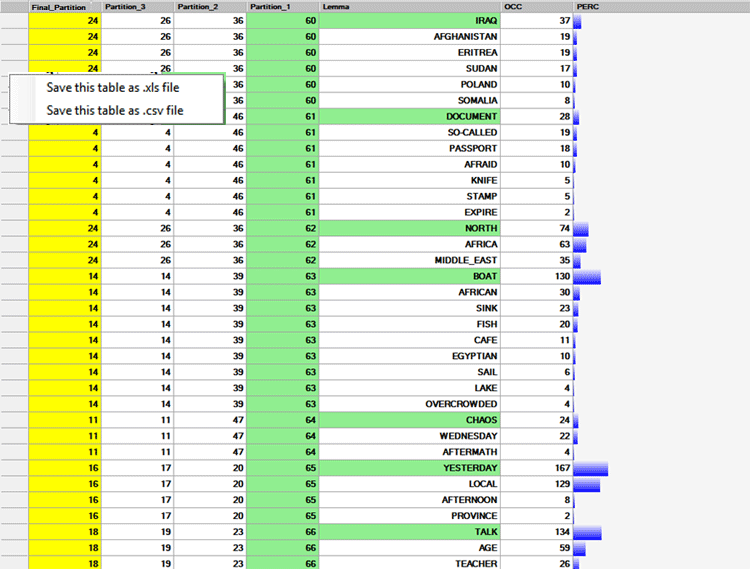
A first table summarizes the characteristics (i.e.
key-terms) of the FINAL PARTITION obtained by the clustering
algorithm.
In such a table, the characteristics of each thematic cluster are
sorted by the TF-IDF value (see below).
N.B.: When a cluster of the final partition consists of only two
words, usually that means a multiword case has not been resolved
during the pre-processing phase.
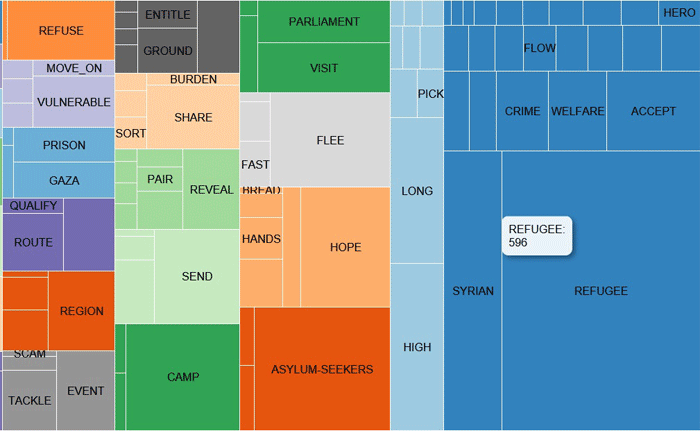
By clicking any word in the above table (as well as
in the ALL PARTITIONS table), a TreeMap allows us to check
the communities to which it results to belongs (see below).
The MDS MAP and the PERCENTAGES
charts (see below) allow us to check the weight of each cluster as
well as their relationships within the final partition (see
below).
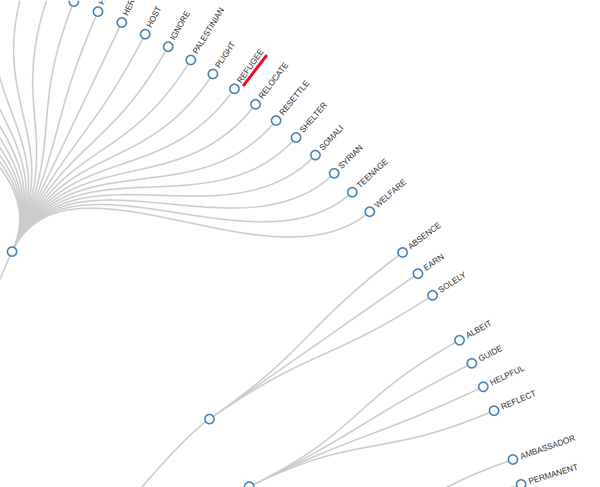
Depending on the number of key-words, two graphs in
HTML format allow us to check the relationships between them,
either within the entire network or within the cluster they belong
to (see below).
|
RADIAL DENDROGRAM
|
|
|
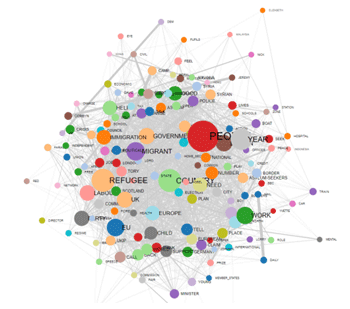
NETWORK GRAPH (FORCE-DIRECTED GRAPH)
|
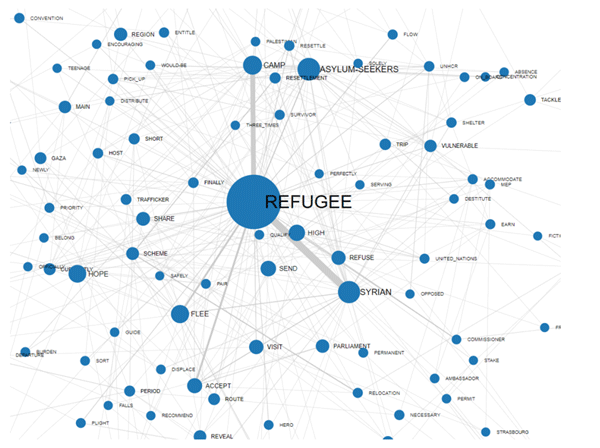
|
Three other tables provide us with further outputs
of the cluster analysis.
In detail:
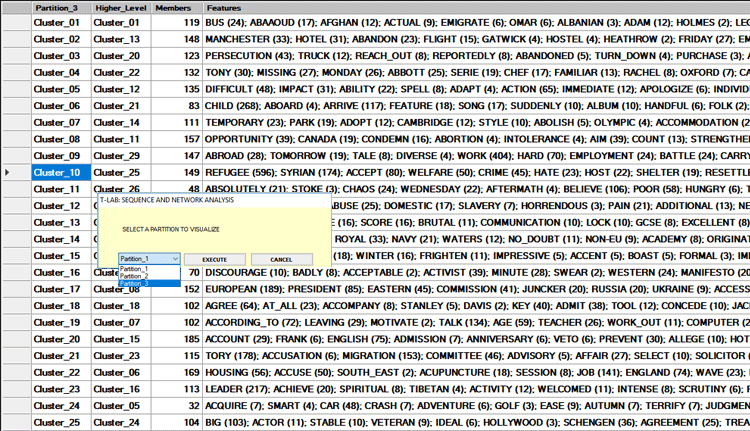
The ALL PARTITIONS table allows us to check
how the key-words have been grouped at each cluster partition (see
the below table, in which the numbers in the partition columns
refer to the various clusters).
N.B.: In such a table, which - by default - is ordered on the first
partition, each shift from one small cluster to the other is marked
by highlighting in green the first word which belongs to
it.
The INTERMEDIATE PARTITIONS table allows us
to check how the key-words have been grouped at any selected
cluster partition.
In such a table, the characteristics of each thematic cluster are
sorted by their occurrence value (see below).
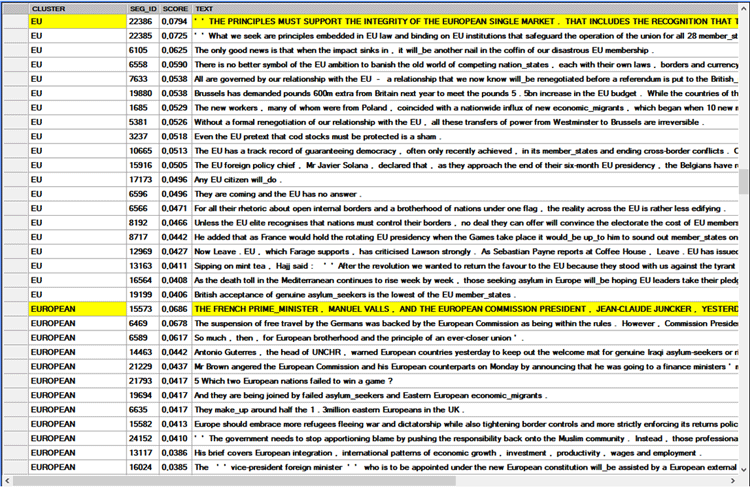
The TYPICAL CONTEXTS table allows us to
check the text segments which have the highest score of association
with the clusters of the final partition. In such tables the
'score' refers to the similarity (cosine index) between the feature
vector of each cluster and the vector in which each text segment is
represented.
N.B. In this table, the most significant text segment of each
cluster is highlighted in yellow.
Like other cases of thematic analysis, T-LAB allows
us to export the dictionary of the final partition which can
be used for further analyses.
C - SOME TECHNICAL DETAILS
The types of sequences that this tool allows us to
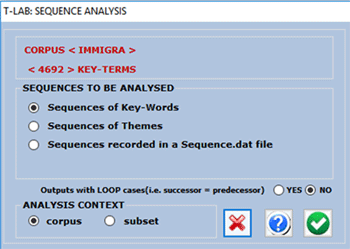
analyse are the following:
1- Sequences of Key-Words, the items of
which are lexical units (i.e. words or lemmas) present in the the
corpus or in a subset of it. In this case the maximum number of
nodes (i.e. 'types' of lexical units) is 5,000;
N.B.: When the automatic lemmatization is applied,
this limit corresponds to about 12,000 words (i.e. raw
forms).
2- Sequences of Themes, the items of which
are context units (i.e. elementary contexts) tagged by a
T-LAB tool for thematic analysis.
N.B.: Since the sequence of elementary contexts
(sentences or paragraphs) characterises the entire 'chain'
(predecessors and successors) of the corpus, in this
case T-LAB performs a
specific form of Discourse Analysis the nodes of which (i.e.
'themes') can vary from 5 to 50.
3 - Sequences recorded in a Sequence.dat
file made by the user (see the the explanation at the end of
this section). In this case the maximum number of records is 50,000
and the number of 'types' (i.e. nodes) must not exceed
5,000.
The following information is provided to help the
user to better understand the data reported in the SUMMARY
table.
According to the graph theory, the predecessors and
the successors of each node (in this case, lexical unit or theme)
can be represented by means of arrows (arcs) coming to (in-degree =
types of predecessors) or going out (out-degree = types of
successors).
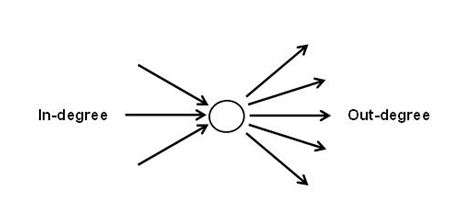
As an example, in the following table "people" has
412 types of successors and 449 types of predecessors.
And its centrality degree is 0.243.
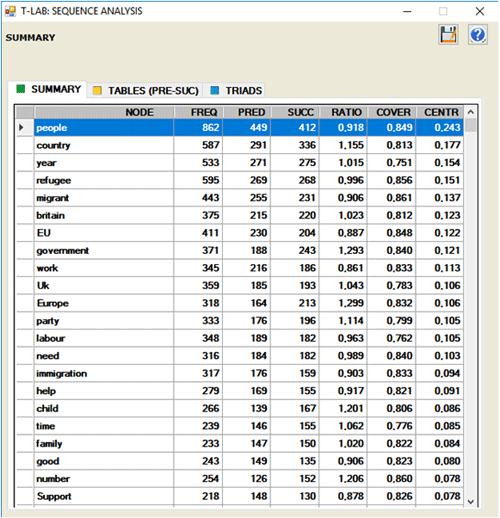
According to their ratio (successors/predecessors),
it is possible to verify the semantic variety engendered by each
node:
- if the ratio is greater than 1, the node is defined "source";
- if the ratio is equal to 1, the node is defined "relay";
- if the ratio is lower than 1, the node is defined
"well".
In the same table, for each lexical unit, the
column "cover" (coverage) indicates the percentage of its
occurrences preceded or followed by lexical units included in the
user list.
When the analysed units cover the totality of those
present within the corpus, the cover value is equal to 1;
otherwise, it is a lower value.
Moreover: when the cover value is equal to 1, the summations of the
probability values (both of predecessors and of successors) are
also equal to 1; otherwise, they have lower values.
In both cases, the residual percentage is determined by the fact
that there are predecessors and successors not included in the
analysis.
For
example, the sequence represented in the following image is
constituted by 39 events: of these, only 16 (the hypothetical units
in analysis) are "covered" (gray boxes). That is because some of
them, e.g. those corresponding to the occurrences of the lexical
unit "A", have predecessors
and successors not included in the analysis (white
boxes).
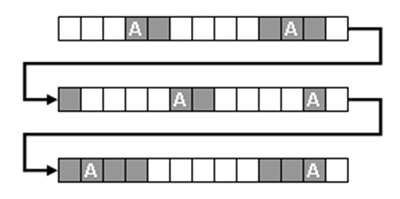
Differently, when the user sequences of themes or
sequences recorded in external files all the events are
covered.
N.B.: In order to analyse an external file, the
user must prepare a 'Sequence.dat' file; then, after opening an
existing project, he must select the 'Sequences recorded in a
Sequence.dat file' option..
The calculation method, the graphs and the tables
are analogous to those already described (see above).
The Sequence.dat file, which can contain numerous
kinds of tags (e.g. names of speakers in a conversation, categories
obtained by content analysis, kinds of events, etc.), must be made
up by "N" lines (min 50 max 50,000), each with a tag of a max of 50
characters, without punctuation marks or blank spaces.
Tag types must be max 5,000.
Here are some lines of Sequence.dat files in the correct
format:
|
Hamlet
King
Hamlet
Queen
Hamlet
Queen
Hamlet
King
Queen
Hamlet
King
Hamlet
Horatio
Hamlet
Horatio
... ... ...
|
activist
food
genetic
conservative
activist
genetic
conservative
activist
commerce
conservative
activist
conservative
biology
society
activist
... ... ...
|
event_01
event_03
event_02
event_03
event_03
event_01
event_05
event_02
event_05
event_01
event_02
event_04
event_03
event_01
event_01
... ... ...
|
Both in the case of sequences concerning the corpus
lexical units (or themes) and of those included in an external file
(Sequence.dat), T-LAB produces several working tables
which can be found in the MY-OUTPUT folder.
|