|
www.tlab.it
Graph Maker
The Graph Maker tool
allows the user to create several dynamic charts in HTML format
which can be used for two purposes:
(a) for exploring co-occurrences
between key words;
(b) for performing some sort of network
analysis.
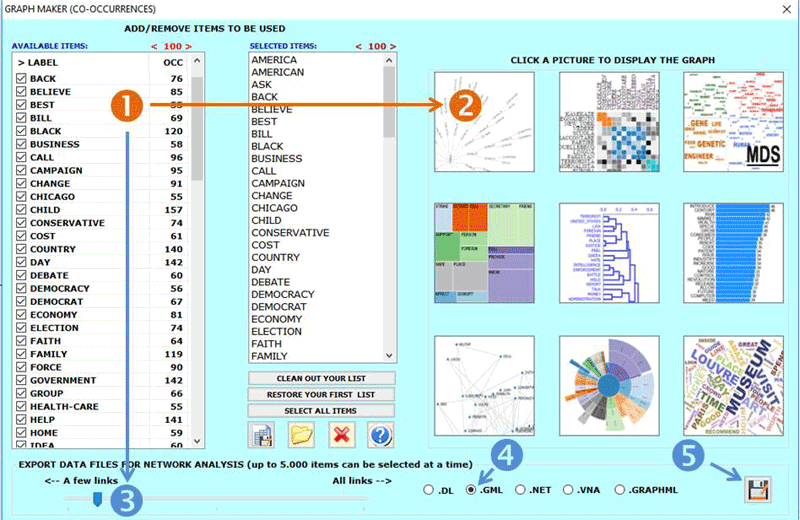
In the (a) case, two steps are required (see the below
picture):
1- Select the items (i.e. key-terms) to be used;
2- Click any picture to display the corresponding graph.
In the (b) case, after the key-term selection (see '1' below), the
user can filter the links to be mapped (see '3' below), then can
choose the output format (see '4' below) and click the 'save'
button (see '5' below).

N.B.: Each output in HTML format includes further
instructions which are easy to understand (see the below
picture).

|