T-LAB Plus 2018

T-LAB Plus 2017
20 January 2017
T-LAB Plus 2019
6 February 2019

T-LAB Plus 2018

T-LAB Plus 2018

Listed below are 10 of the key improvements and new features:

1 - the Sequence and Network Analysis tool, which takes into account the positions of words relative to each other (i.e. transition probabilities), has been completely redesigned and now the user is able to check the relationships between the 'nodes' (i.e. the key-terms) of the text network at different levels:

a) in the one-to-one connections;

b) in the 'ego' networks;

c) within the 'communities' (i.e. thematic clusters) to which they belong;

d) within the entire text network.

ONE-TO-ONE
EGO-NETWORK
COMMUNITIES
COMMUNITIES
ENTIRE NETWORK

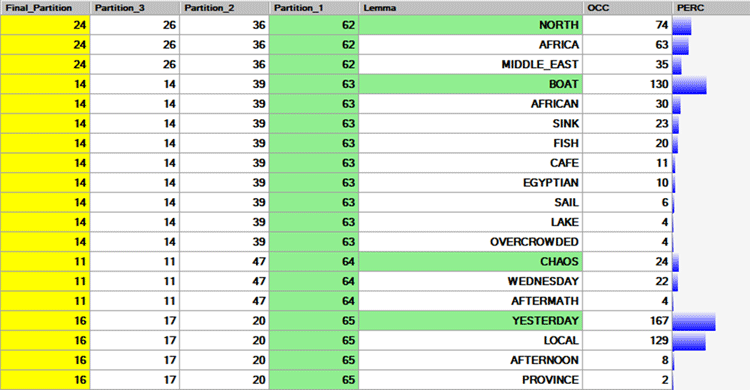
Also it is possible to check how the key-words have been grouped at each cluster partition (see the below table).

N.B.: The clustering algorithm is based on the Louvain method for community detection (see Blondel V.D., Guillame J.-L , Lambiotte R., Lefebre E., 2008)


Moreover it is possible to check the text segments which have the highest score of association with the clusters of the final partition.


For more information about the above functionalities, and for better understanding how they allow the easy exploration of all levels of the network hierarchy, click here.

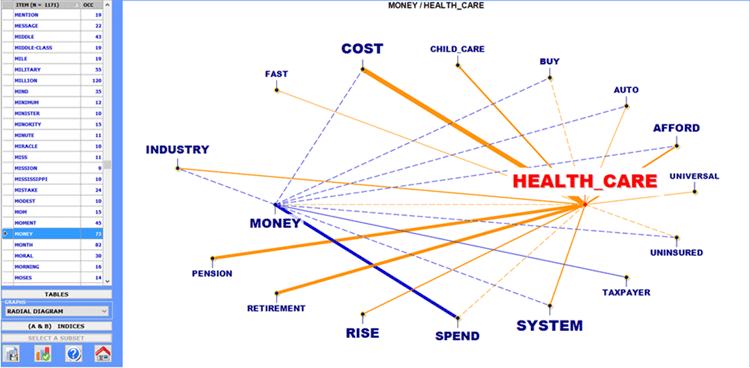
2 - In the Comparison between Word Pairs sub-menu, a new radial diagram is now available which allows the user to quickly appreciate similarities and differences in word associations, either within the entire corpus or within a subset of it (see the image below).


3 - Most of the tools for co-occurrences analysis and thematic analysis can now work with key-term lists containing up to 5,000 items. So, when the automatic lemmatization is applied, this limit corresponds to about 12,000 words (i.e. raw forms).

4 - When analysing files which include Twitter messages, it is now possible to use strings with hashtags (i.e. the '#' character) as key-terms.


5 - When using any comparative tool based on contingency table analysis, T-LAB now creates heatmap tables with up to 10,000 rows which usually correspond to distinct key-terms (see the image below).


6 - When plotting the results of any Correspondence Analysis or Multidimensional Scaling, the scatter charts can show labels, the dimensions of which are based on the word frequency (see the images below).


7 - When performing a topic analysis or a thematic analysis of a corpus which includes variable attributes, it is now possible to build and analyse tables which cross the topics (or themes) and the attributes of each variable (see the image below).


8 - When using any thematic analysis tool a new output is now available which allows the user to quickly evaluate the most typical words of each 'topic' or of each 'thematic cluster' (see the image below).


9 -A new tool - named Corpus Advanced Search - is now available which allows the user to extract all text segments (i.e. sentences or paragraphs) which match single or multiple selection of words, either within the entire corpus or within a subset of it.

When performing multiple selections it is possible to use logical operators (e.g. 'AND', 'AND/OR', 'OR'), and when performing a single selection it is possible to search for strings which match criteria like 'are equal to', 'start with', ' 'end with' and 'contain' (see the below image).


10 -Some pre-processing steps, including the automatic lemmatization, have been improved.


Click here to consult the manual.